GENCODE Custom lncRNA Expression Microarray Design
We have created a custom long non-coding RNA expression array design with probes targeting the Gencode v15 human lncRNA annotation.
Gencode Version 15
- Array: gencode.v15.lncrna.2probe.version1
- Agilent Design ID (AMADID): 047718
- Format: 8x60k
- Transcript level
- Probes designed against Gencode v15 lncRNAs:
- 2 probes per lncRNA transcript
- 22001 targeted lncRNA transcripts
- 17535 randomly selected protein coding targets
Similar arrays designed against an earlier version of GENCODE lncRNA annotations
were described in the following publication:
The GENCODE v7 catalog of human long noncoding RNAs: analysis of
their gene structure, evolution, and expression.
Gencode Version 7
- Array: gencode.v7.lncrna.version1
- Agilent Design ID (AMADID): 036162
- Format: 8x60k
- Transcript level
- Probes designed against Gencode v7 lncRNAs
- 4 probes per lncRNA transcript
- 14880 targeted lncRNA transcripts
- 2899 randomly selected protein coding targets
Because the design is a standard custom Agilent format, researchers can freely order microarray slides for their own projects, via the Agilent Technologies eArray system or else can employ hybridisation services such as that offered by the Centre for Genomic Regulation Genomics Core Facility. For further information and assistance please contact Rory Johnson.
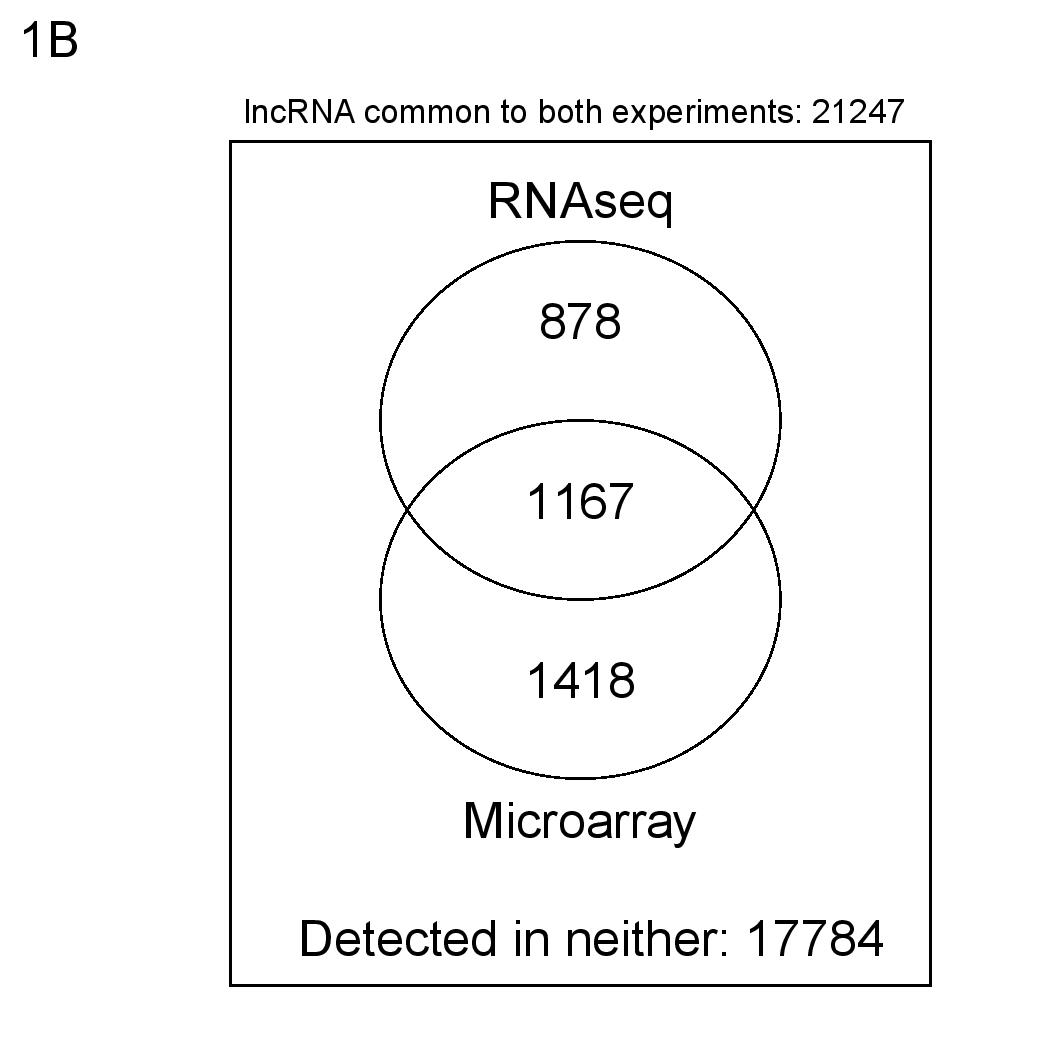
Quality Control of Gencode 15 LncRNA Microarray by Comparison with RNAseq
To check the performance of the Gencode 15 LncRNA microarray, we carried out a comparison with RNAseq gene quantification. We hybridised whole-cell K562 RNA to the microarray and compared resulting expression intensity values with ENCODE RNAseq (Gencode 16 quantifications), separately for protein coding genes and lncRNA transcripts.
For RNAseq data, genes or transcripts are considered present if RPKM mean > 0 and IDR < 0.1. For microarray data, genes or transcripts are considered present if more than half of their probes are defined as "reliable" and "present". Hybridisation and data normalisation were carried out as described in Derrien et al (PMID 22955988).
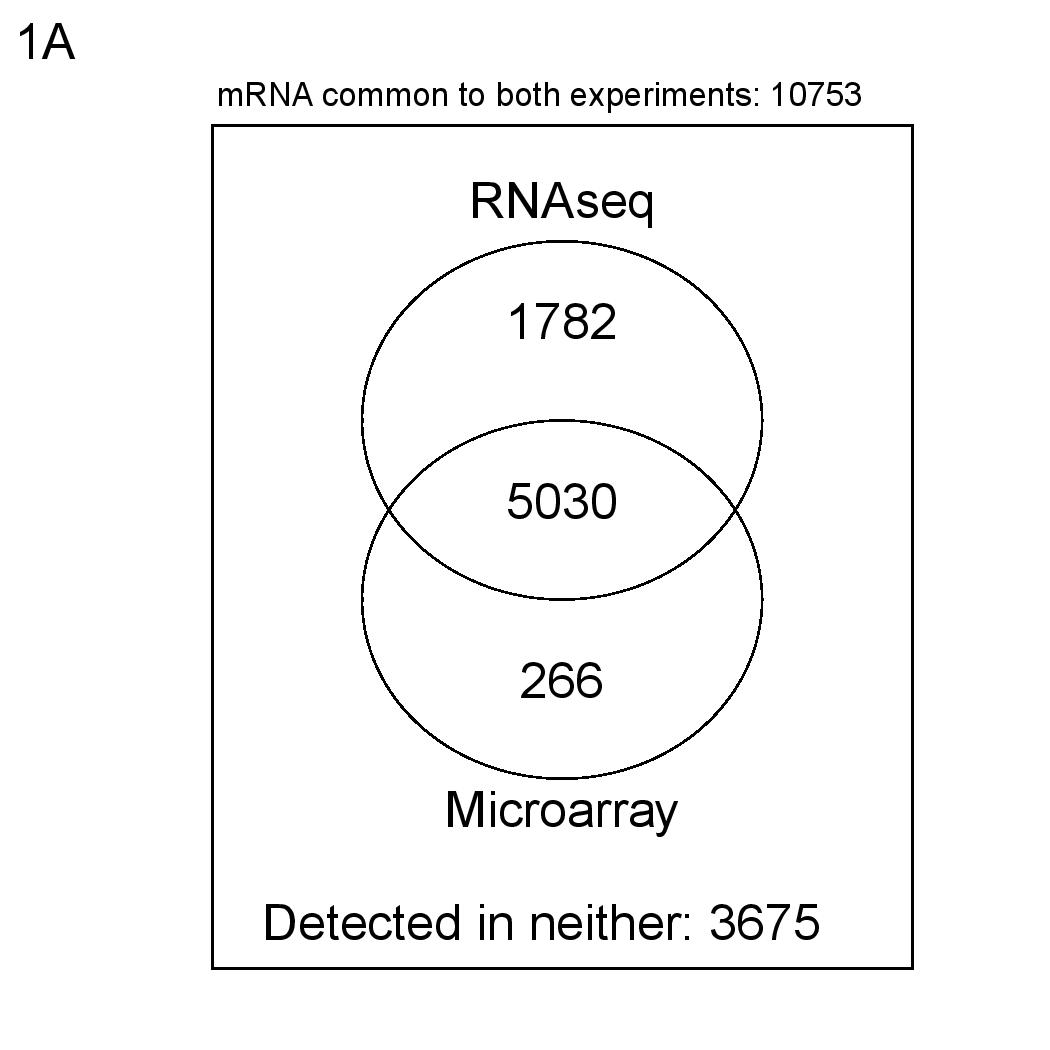
Numbers of detected mRNAs according to the above definitions.
Numbers of detected mRNAs according to the above definitions.
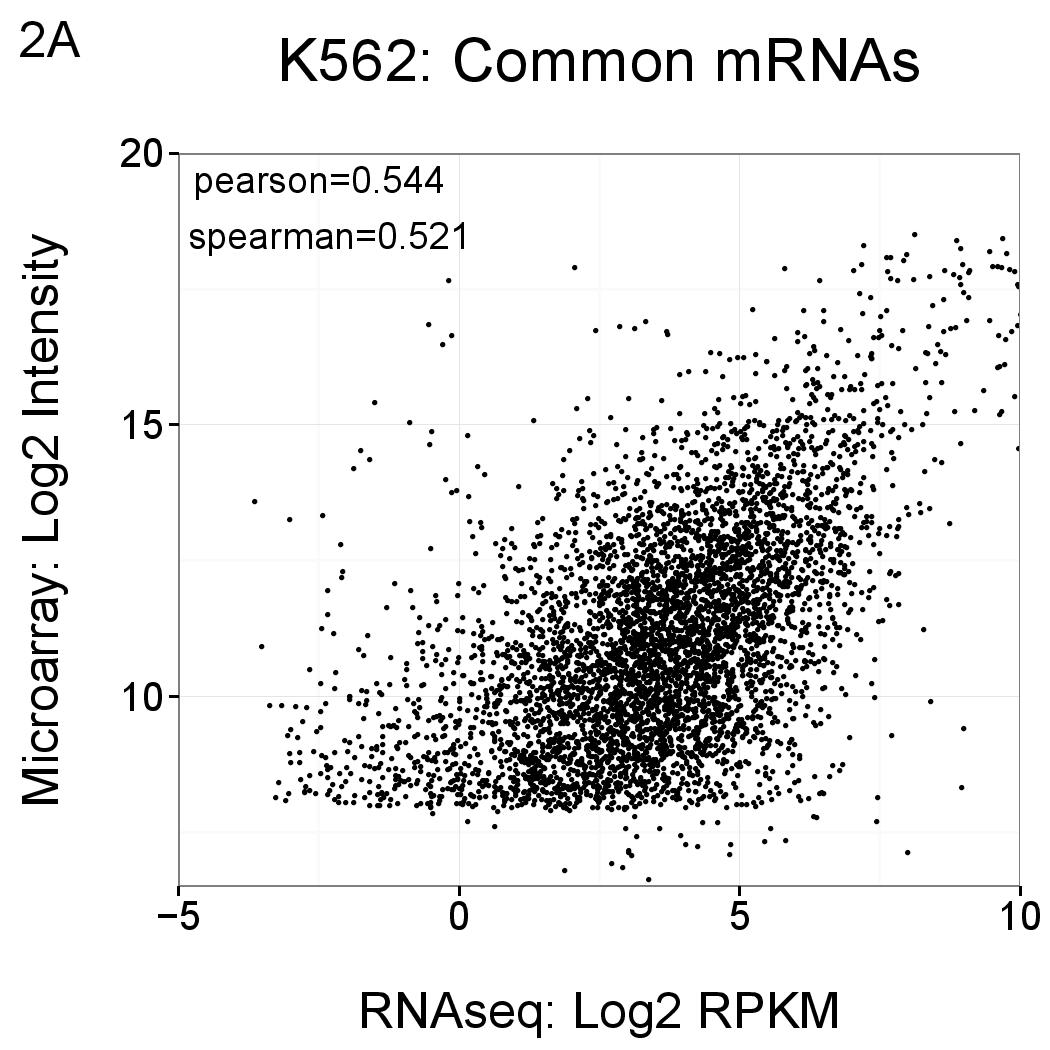
Comparisons of the levels of mRNAs as reported by RNAseq (x axis, log2 RPKM) and Gencode v15 microarray (y axis, log2 normalised intensity). Each point represents an annotated gene that is detected by both methods (ie the intersections shown in Figure 1) using the thresholds described above. Correlations are comparable to previous lncRNA microarray versions (see Derrien et al PMID 22955988, Supplementary Figure 11), as well as independent studies (for example Fu et al PMID 19371429).
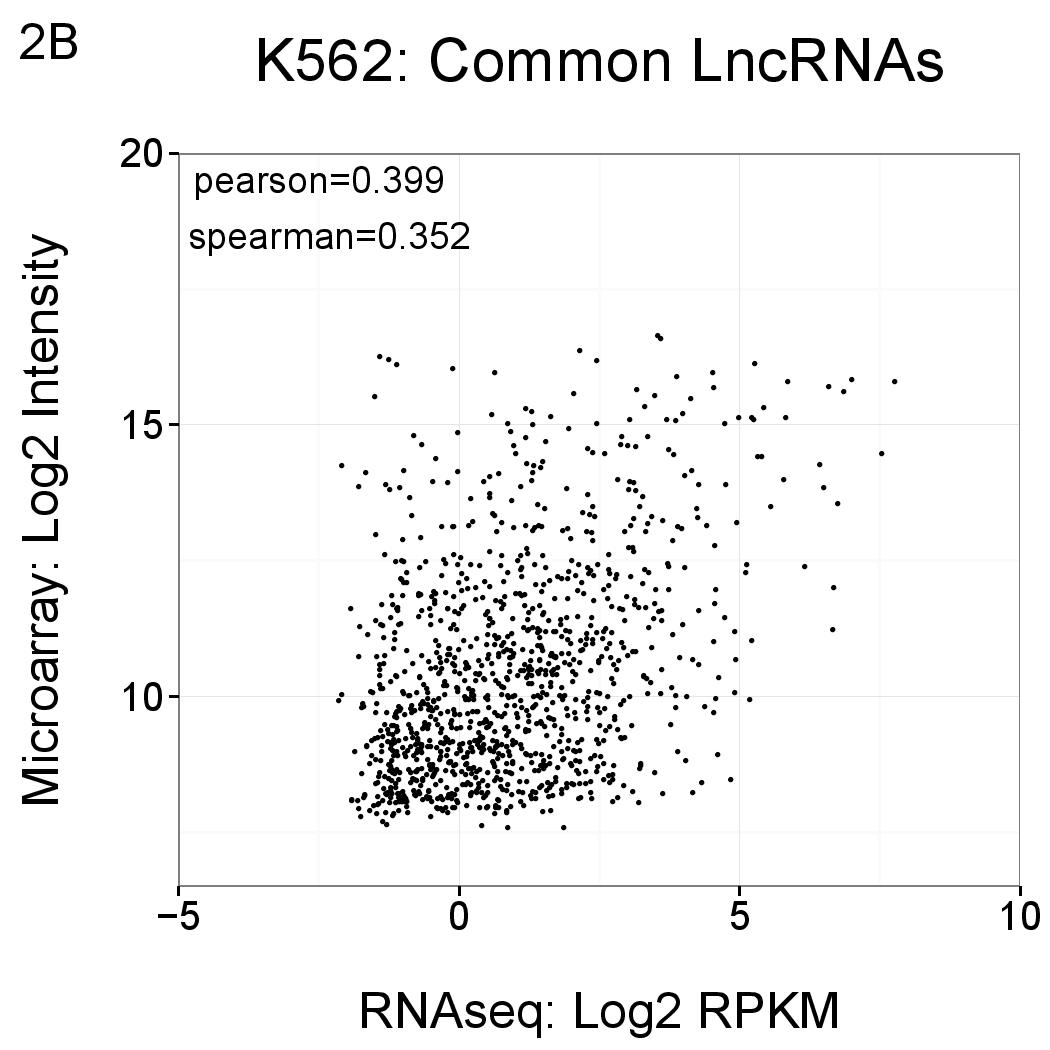
Comparisons of the levels of lncRNAs as reported by RNAseq (x axis, log2 RPKM) and Gencode v15 microarray (y axis, log2 normalised intensity). Each point represents a transcript that is detected by both methods (ie the intersections shown in Figure 1) using the thresholds described above. Correlations are comparable to previous lncRNA microarray versions (see Derrien et al PMID 22955988, Supplementary Figure 11), as well as independent studies (for example Fu et al PMID 19371429).
Acknowledgements: Sarah Bonnin, Maria Aguilar, Anna Ferrer for array hybridisation and normalisation (CRG Genomics Unit); Joana Carlevaro for data analysis (CRG Bioinformatics and Genomics); Eulalia Marti for kindly donating the micrarray (CRG Bioinformatics and Genomics).